Population
Population is the number of people who live in a place.
Demography is the statistical study of human populations especially with reference to size and density, distribution, and vital statistics.
Population Metrics
The total population of an area is the number of people that live in an area. This metric is commonly used within political boundaries like countries, states or cities. Total population is not a constant number, since people are constantly being born, moving to other areas, or passing away. In smaller areas, total population also becomes a more complex concept since people are mobile and constantly moving between different places for work, education, recreation, health care, etc.
Growth in the population of an area is strongly affected by fertility, or the number of children that women have during their reproductive lifetimes. The fertility rate of a country is commonly measured as the average number of children that are born to women in a country over their childbearing years.
The crude birth rate is the total number of children born in a country per thousand residents. Crude birth rate is similar to fertility rate, but accounts for situations where there are an extraordinarily high percentage of young or old people in a country.
The flip side of fertility is mortality, or the rate at which people die in a society. The crude death rate can be used along with the crude birth rate to assess the population growth or shrinkage in an area that is due to more people being born than dying, or vice versa.
One major cause of death is infant mortality: the number of children that do not live to see their first birthday. This rate is commonly give in number of deaths per 1,000 live births in a given year. High infant mortality is commonly associated with high levels of poverty, where mothers do not have access to quality nutrition, sanitation, and/or medical care.
At the other end of the life spectrum, life expectancy is the number of years that someone can expect to live based on current conditions. While the life span of an individual is strongly influenced by individually-unique factors like lifestyle choices and genetics, the overall life expectancy of a society is strongly correlated with peace and prosperity.
The absolute population number of an area is often less meaningful than population density: the number of people per unit of land. There are a number of different ways of calculating population density that are useful for assessing different characteristics of a society:
- Arithmetic density is the population divided by the total area of land. For example, the World Bank gives population as people per square kilometer of land area. While this is the simplest method of calculating density, it is less meaningful for large areas which often contain clusters of highly-dense cities interspersed with low-density rural areas
- Physiological density is the total amount of arable land divided by population. This density metric is especially useful for assessing whether a nation can feed itself or is dependent on agricultural imports. Physiological density is often expressed in hectares per person, where a hectare is a metric unit for area equivalent to a bit less than two American football fields
- Agricultural density is the amount of arable land divided by the number of farmers. This metric is helpful for assessing the productivity of agriculture in a country. Countries with high agricultural density have large numbers of small farmers, often subsistence farmers, who are often less productive than post-green-revolution countries with a small number of farmers with large machines that can cultivate large areas of land with little labor
Demographic Transition
In 1929, American demographer Warren Thompson (1887-1973) proposed a model for how population changes as societies develop. Similar models were proposed independently by Adolphe Landry (1934) and Frank Notestein (1945). This model has come to be known as the demographic transition (Kirk 1996) and describes how birth and death rates tend to change during the development process and affect population growth. The model has five stages:
- Stage I: Pre-Industrial
- Birth Rates: High
- Early marriage
- Children needed for farm labor and care in old age
- No contraception, patriarchal societies where women have few options other than child rearing
- Death Rates: High
- High levels of disease
- Frequent hunger from erratic and unreliable food sources
- Warfare and violence
- Population: Low and stable
- High death rates keep births in check
- Condition for most of human history
- Birth Rates: High
- Stage II: Developing
- Birth Rates: High
- Reproductive practices persist from pre-industrial era
- Death Rates: Decreasing
- Technological development
- Economic development
- Improved nutrition, hygiene and medical care
- Population: Begins to grow rapidly
- Lower death rates not offset by lower birth rates
- Birth Rates: High
- Stage III: Stabilizing
- Birth Rates: Decreasing
- Decreased mortality reduces need for children
- Contraception becomes available
- Women are empowered and needed to work outside the home to support a growing economy
- Death Rates: Low
- Improved agriculture and nutrition
- Improved sanitation and medical care
- Population: Begins to stabilizing at a high level
- Birth Rates: Decreasing
- Stage IV: Industrial
- Birth Rates: Low
- Death Rates: Low
- Population: Stable at high level
- Modest levels of economic growth
- Stage V: Post-Industrial (some authors consider this to be part of
the fourth stage rather than a separate stage)
- Birth Rates: Very low
- Cost of raising and educating children is high in a complex economy
- Couples choose comfortable lifestyle over childbearing
- Children are often perceived as more of a burden than blessing
- Death Rates: Low but rising
- Continued good nutrition and medical care
- Population becomes increasingly older overall with increasing mortality
- Population: Decreases below replacement level
- Can be offset by migration
- Fewer young workers to pay and work for growing elderly population
- Generational conflict
- Economic decline feeds back into even lower birth rates
- Birth Rates: Very low
Because of the vital role that health and disease play in fertility and mortality, the demographic transition is also sometimes analyzed as an epidemiological transition (Omran 1971 / 2005), where the analysis of demographic changes is seen in terms of changes in disease control, medical care, and sanitation.
The following are videos of simulations of how the demographic transition works. The first video shows population stabilizing in the fourth stage. This is an optimistic scenario often envisioned by where a large population can live modern lifestyles without exhausting the resources needed to support that lifestyle:
This video shows progression through the fifth stage where population begins to decline. This is a pessimistic scenario often envisioned by catastrophists that foresee society returning to a more localized, less-developed lifestyle similar to the way humans lived before industrialization.
The R code for these simulations is available HERE...
Age Distributions and Population Pyramids
Because people can live for many decades, changes to birth and death rates often take many decades to affect total population, and the associated changes to the number of people at different ages in the society can dramatically affect the economic and political relationships in a society.
As countries enter stage III of the demographic transition, a youth bulge results in a large, young labor force with a comparatively small number of children or older citizens they have to work to support. This surplus of labor provides a demographic dividend to the economy. However, cheap labor economies reach the Lewis (1954) Turning Point where the amount of surplus labor dwindles, wages rise, profits dwindle, and investment falls. And, the demographic dividend will eventually become a shock of gray (Fishman, 2010) when those young people move into their later years with a smaller younger generation to support them.
One common metric for this phenomenon is the age dependency ratio: the ratio of dependents (people younger than 15 or older than 64) to the working-age population between the ages of 15-64. A higher dependency ratio means that each worker is having work to support him/herself as well as a larger number of children and/or retired people. This represents a constraint on the productive capacity of an economy and economic growth, which means reduced standards of living for everyone. For example, the US had a dependency ratio of 51 in 2015 (close to the global value), while a number of troubled African countries like Angola, Chad and Uganda had dependency ratios over 100 (each worker supports not only themselves but an average of one other person).
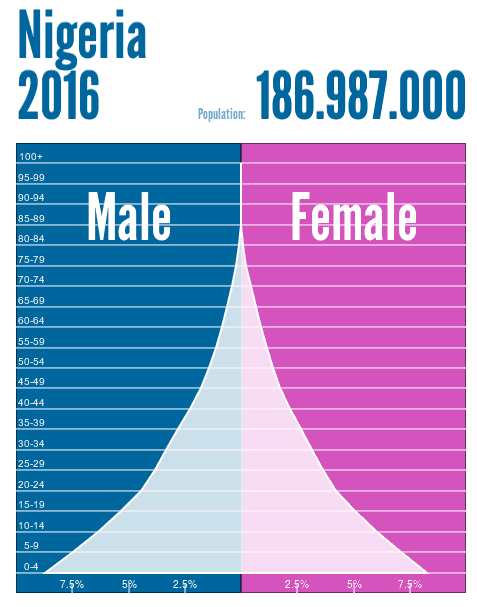
The age distribution of a society can be visualized as a population pyramid, where the y-axis is the range of ages and the x-axis is the numbers of people in an area at those different ages.
For example, Nigeria is a quickly growing country somewhere in stage II or III of the demographic transition. The country has a large, fertile cohort of young people, and a dependency ratio of 88. This presents significant stresses on resources, housing, infrastructure, education, etc.
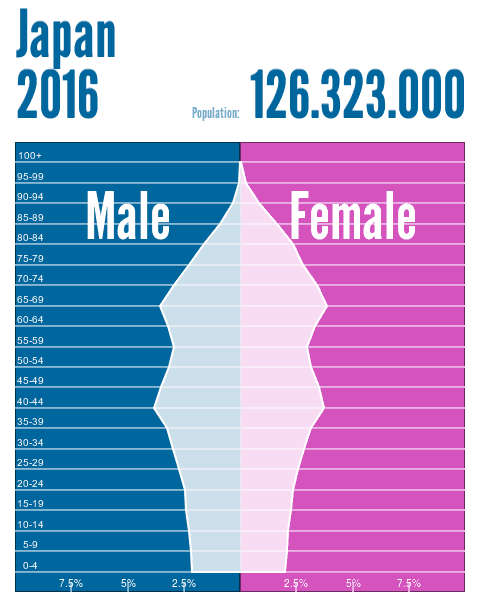
At the opposite end of the demographic transition is Japan, a highly-industrialized, technologically-advanced country with very low birth rates and declining population. In contrast to the labor surpluses of countries like Nigeria, Japan, and many other developed countries like it, are beginning to face labor shortages and economic stagnation, and will struggle to support and care for their growing cohort of elderly residents. The elevated-and growing dependency ratio of 64 reflects this increasing challenge to Japanese society.
Martin De Wulf's Population Pyramids of the World is an excellent resource to find historic and current population pyramids for most of the world's countries.
Population Growth and Regional Differences
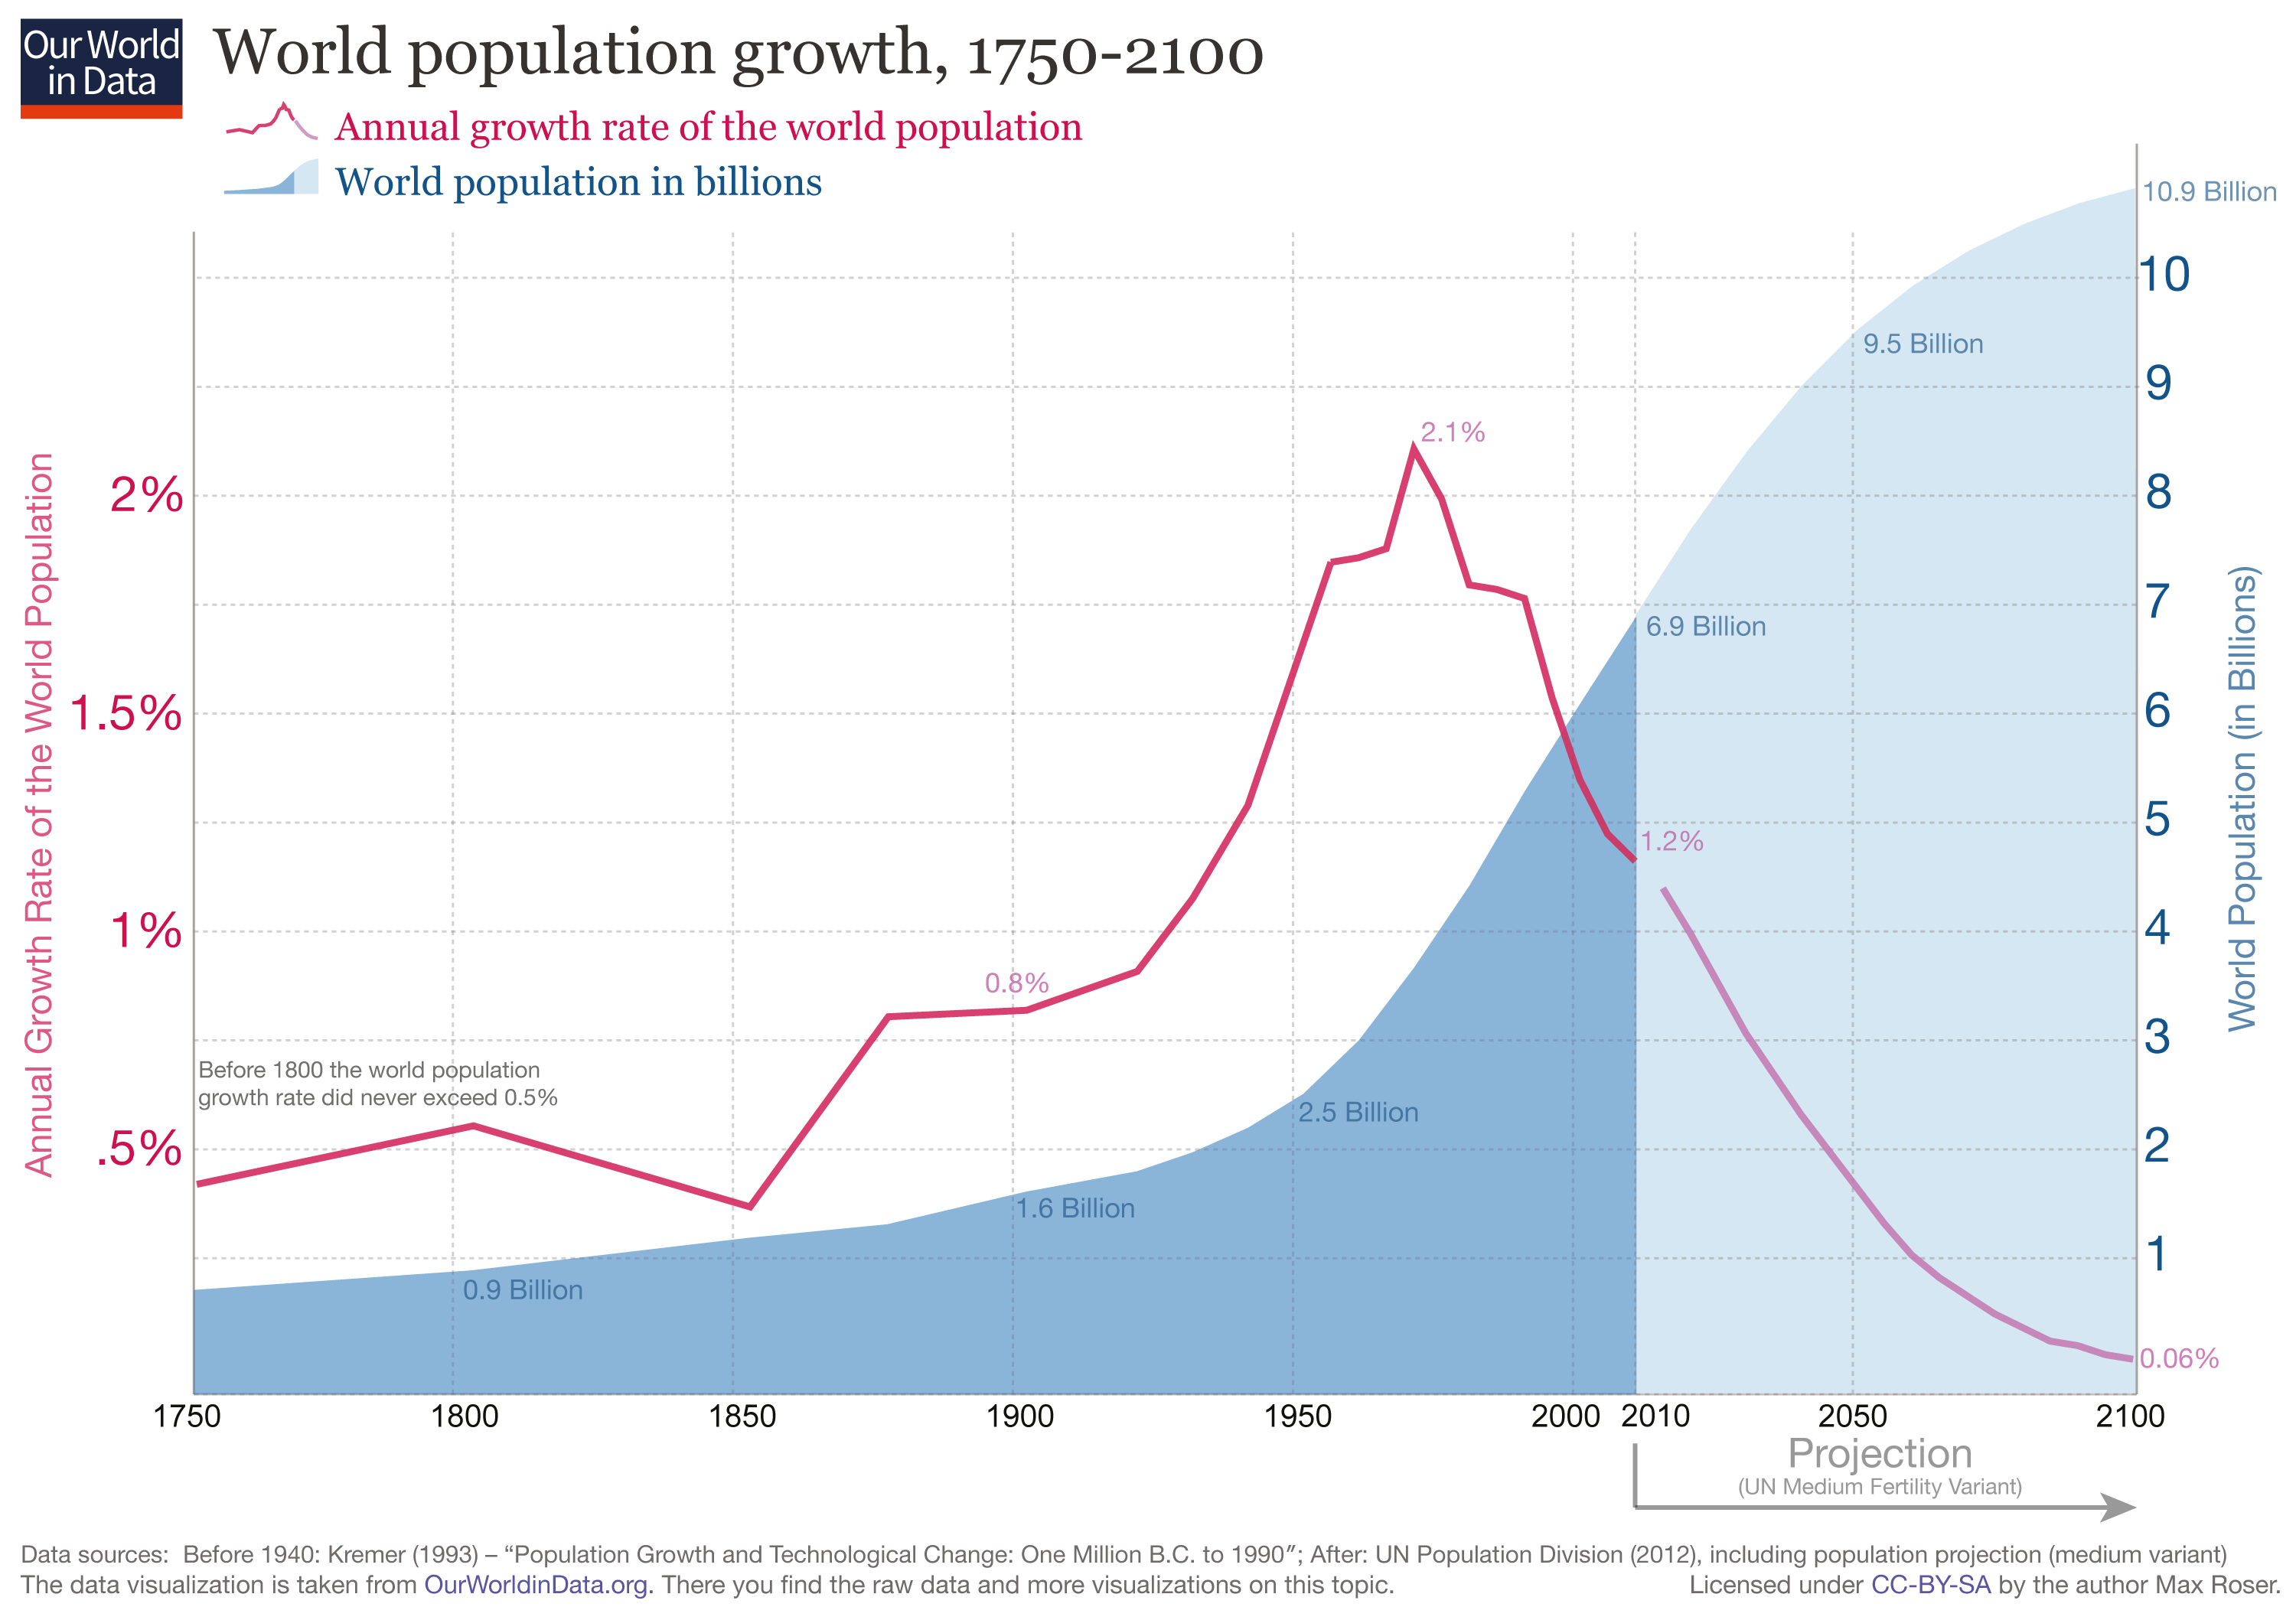
One metric commonly used to assess where a society is in its demographic transition is annual population growth.
World population began growing significantly during the Industrial Revolution as countries began moving into stage II of the demographic transition. Presuming that the world as a whole moves into stage IV or V during the 21st century, estimates of peak world population vary around 11 billion people.
Esteban Ortiz-Ospina and Max Roser (2016) discuss historic population estimates and population trends in much greater detail.
Demographic transition is not a smooth process across time or across the surface of the earth. Notably, countries in Sub-Saharan Africa and South Asia still have high levels of fertility and associated population growth. This presents significant challenges for resource use, infrastructure, and political contention. But these growing populations also represent potential if the economic and political leaders of these countries can find a way to utilize those labor and creative resources to the benefit of their society.
Migration
Few societies are entirely closed systems where population is determined solely by the birth and death rates of its residents.
Migration is a permanent move of people to a new location
Emigration is migration OUT OF a location
Immigration is migration IN TO a location
Net migration is the difference between emigration and immigration in an area. Positive net migration means more people are moving in than moving out. Negative net migration means more people are moving out than moving in
People migrate for a vast number of reasons, but those reasons can be categorized into two (often interconnected) groups:
- Push Factors: Conditions that push people out of their homes. Examples include:
- Political: War, persecution, famine
- Economic: Unemployment, poor economy,
- Environmental: Drought, flood
- Social: Gang violence, forced marriage
- Pull Factors: that attract people into new areas. Examples include:
- Political: Democracy, freedom of speech
- Economic: Jobs, available farmland, opportunities for entrepreneurship, education, slavery
- Environmental: Available farmland, adequate rainfall, comfortable climate
- Social: Family connections
Chain migration occurs when a first migrant or group of migrants are followed by relatives or other members of their home country. For example, Kanjibhai Desai was an undocumented immigrant from the Indian state of Gujarat who started running a youth hostel in San Francisco in the 1940s. After immigration laws were liberalized in 1965, Desai's success inspired many people from Gujarat to come to the US, pool their resources, and buy or develop motels across the US, ultimately leading to control of half the motels in the country (Starr 2016) (Constable, 2015).
Similar to the concepts of demographic and epidemiological transition, geographer Wilbur Zelinsky (1971) suggested that there is also a migration transition or mobility transition that countries go through as they develop:
- Stage 1: Daily or seasonal migration in search of food
- Stage 2: International migration or rural-to-urban migration
- Stage 3: Migration within countries or between cities and suburbs
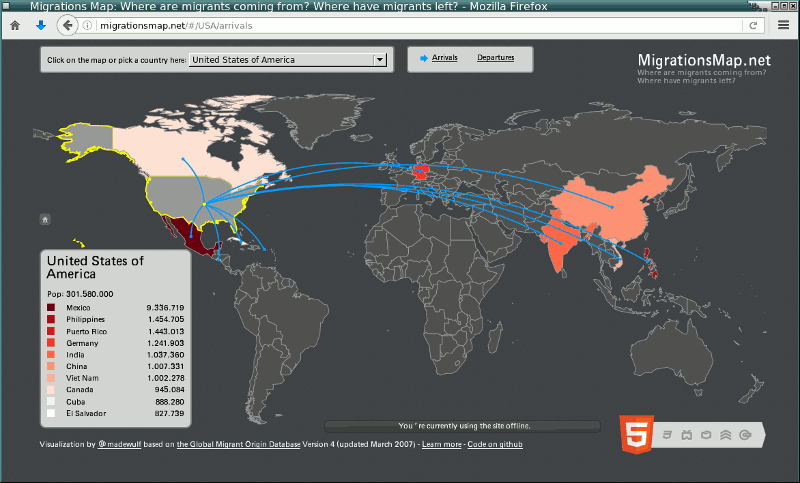
Patterns of migration are complex, with constant flows of people into, out of, and through countries. Martin De Wulf's MigrationsMap.net uses data from the (somewhat outdated) 2007 Global Migrant Origin Database to visualize estimates of migrant origin and destination countries around the world.
Migrants vs Refugees
The United Nations High Commission on Refugees estimated that in 2015 there were around 65.3 million forcibly displaced people worldwide. This included around 21.3 million refugees, about a quarter of which are fleeing the war in Syria. Another 38.2 million people are internally displaced persons within their own country.
A significant legal distinction that affects what happens to migrants is whether they are considered migrants or refugees.
While a migrant is simply a person moving to another country (often for economic reasons), a refugee is a person who has fled his or her country to escape war or persecution, and can prove it. (Sengupta 2015). Migrants can be refused entry or deported, but refugees are entitled to protection under the internationally-negotiated 1951 Refugee Convention. Refugees can apply for (often temporary) political asylum and cannot be returned to home countries where their lives are in danger.
The dramatic increase in migrants/refugees fleeing both war and economic hardship in the Middle East and North Africa and attempting to migrate to Europe has created tremendous controversy and political backlash in Europe over whether these migrants are entitled to refugee status and how they should be treated when they arrive in Europe.